How to Read Horse Racing Odds: Fractional, Decimal and American Formats
Best Horse Racing Betting Sites – Bet on Horse Racing in 2026
Loading...
How to read horse racing odds is a question that trips up more punters than most would care to admit. You pull up a race card on your phone and see 5/1 with one bookmaker, 6.00 with another, and -200 on some American platform you accidentally wandered onto. Same horse, same race, three completely different numbers. Decoding the numbers on the betting board can feel like it requires a mathematics degree—it doesn’t.
The confusion is understandable. Fractional odds have been the standard at British racecourses for generations, embedded in the culture of UK racing from Aintree to Ascot. Then betting exchanges arrived and brought decimal pricing with them. International coverage introduced American moneylines into the mix. And now, with more than 80 per cent of bets at major festivals placed through mobile devices, punters flip between apps that each present odds in their preferred format.
This isn’t abstract numeracy. Every format tells you exactly the same thing—how much you stand to win relative to your stake, and by extension, what the bookmaker or market believes about a horse’s chances. The difference is purely presentational. Once you grasp the relationship between the three systems, you can convert between them almost instantly and, more importantly, recognise when one platform offers better value than another.
What follows is a methodical breakdown of each format. We’ll start with fractional odds, the heritage system you’ll encounter at every British racecourse and most high-street bookmakers. Then decimal, the cleaner format favoured by exchanges and increasingly by online betting apps. Finally, American odds—not commonly used in UK racing, but worth understanding if you ever venture into international markets or US coverage. By the end, you won’t just read odds. You’ll understand what they mean.
Fractional Odds: The Traditional UK Format
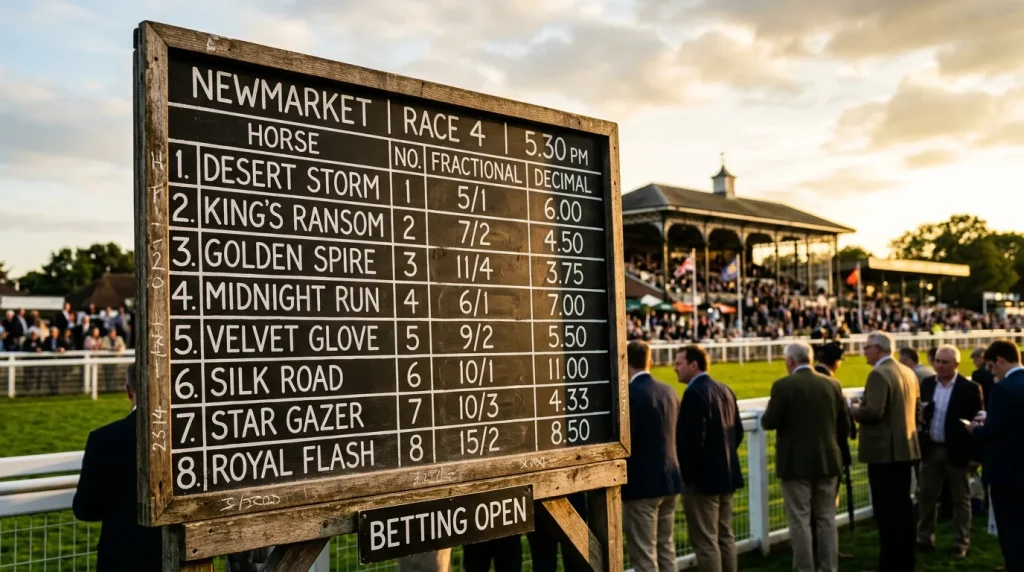
Walk into any betting ring at a British racecourse and you’ll see bookmakers’ boards displaying prices like 5/1, 7/2, or 11/4. This is fractional pricing, the format that has defined UK racing betting for over a century. Those 5.031 million people who attended British racecourses in 2026—the first time attendance exceeded 5 million since 2019—according to the British Horseracing Authority’s Racing Report, almost exclusively encountered fractional odds on-course. It’s the language of the betting ring, and understanding it is foundational to betting on horses in Britain.
The mechanics are straightforward once you see the pattern. A fractional odd like 5/1 (spoken as “five to one”) tells you that for every £1 you stake, you’ll receive £5 in profit if your horse wins. Add your original stake back, and your total return is £6. The formula works consistently: profit equals stake multiplied by the numerator, divided by the denominator. At 7/2 (“seven to two”), a £2 stake returns £7 profit plus your £2 back, totalling £9. At 10/1, a tenner becomes £110.
Where beginners often stumble is with odds-on prices—fractions where the first number is smaller than the second. When you see 1/2 (“one to two” or “two to one on”), the horse is a strong favourite. Here, you must stake £2 to win £1 profit. Your total return is £3, but you’ve risked more than you stand to gain. Shorter prices follow the same logic: 4/9 means staking £9 to win £4; 8/13 means risking £13 to win £8. The tighter the fraction, the shorter the price and the stronger the market’s confidence in that horse.
Some fractional odds appear awkward on first encounter. What do you do with 11/8 or 85/40? The same calculation applies, just with less tidy numbers. At 11/8, an £8 stake returns £11 profit plus your stake—£19 total. Most punters mentally convert these to decimal equivalents for quicker calculation, but at the track, fractional remains standard.
The common fractional odds you’ll encounter most frequently have natural patterns. “Evens” (written as 1/1 or sometimes EVS) means equal risk and reward—stake £10, win £10, receive £20 total. The prices 2/1, 3/1, 4/1 and upwards represent progressively longer shots. Each step up doubles the potential profit relative to 1/1. Between these round numbers sit the half-points: 5/2 sits between 2/1 and 3/1, offering £2.50 profit per £1 staked.
Why does fractional pricing persist when decimal is arguably simpler? Partly tradition, partly practicality. On a racecourse, shouting “five to one” across a noisy betting ring is clearer than “six point oh.” The format also makes it immediately obvious whether a horse is odds-on or odds-against—if the first number is smaller, you’re backing a favourite. For generations of British punters, fractional odds are simply how racing prices look. That’s reason enough for them to endure, even as digital platforms increasingly offer alternatives.
One practical note: when bookmakers adjust prices, they typically move between established fractional increments. A horse might shorten from 5/1 to 9/2 to 4/1, not to 4.75/1 or some other arbitrary figure. This stepped pricing creates natural breakpoints and, occasionally, opportunities where one bookmaker hasn’t yet moved to match the market.
Decimal Odds: The Modern Standard
Decimal odds have become the default format for betting exchanges and most online platforms, and there’s a good reason: they’re easier to calculate. When you see a horse priced at 6.00, you instantly know that a £10 stake returns £60 total. No mental gymnastics with numerators and denominators—just multiply your stake by the decimal figure. That single number represents your total return including the original stake, not just the profit.
This simplicity matters increasingly because of how punters actually bet. Data from Receptional’s industry analysis showed that more than 80 per cent of bets at the 2026 Cheltenham Festival were placed via mobile devices. When you’re thumbing through multiple apps comparing prices, decimal odds let you make instant comparisons. Is 6.00 better than 5.50? Obviously. Is 5/1 better than 11/2? That requires a moment’s thought.
The conversion from fractional to decimal is straightforward. Take the fractional odds, divide the first number by the second, then add 1. At 5/1, that’s 5 divided by 1, plus 1, equals 6.00. At 7/2, it’s 7 divided by 2 (3.5) plus 1, equals 4.50. At 1/2 (odds-on), it’s 1 divided by 2 (0.5) plus 1, equals 1.50. The “plus 1” accounts for your stake being included in the decimal return.
Betting exchanges like Betfair operate exclusively in decimal because the format handles precision better. When you’re backing a horse at 5.9 and laying at 6.0, that incremental difference matters—and expressing it as something like “59/10 versus 5/1” would be absurd. Exchanges also update prices constantly, and decimal increments allow for smoother, finer adjustments than the stepped moves of fractional markets.
The shift towards online betting has accelerated decimal adoption. Remote gambling has grown from roughly 15 per cent of the UK market in 2012 to approximately 60 per cent by 2026, according to Social Market Foundation analysis. That’s a fundamental transformation in how people bet, and with it has come a gradual normalisation of decimal pricing among younger punters who’ve never queued at a high-street bookmaker.
One advantage of decimal that’s easy to overlook: calculating implied probability. At decimal odds of 4.00, the implied probability is simply 1 divided by 4, or 25 per cent. At 2.00, it’s 50 per cent. At 10.00, it’s 10 per cent. This becomes crucial when you start thinking about value betting—assessing whether a horse’s true chances exceed what the odds imply. We’ll return to implied probability in more detail later, but note how decimal makes that calculation almost instantaneous.
Most UK bookmaker apps now let you toggle between fractional and decimal display in settings. If you’ve been raised on fractional but want to compare prices across exchanges and bookmakers efficiently, switching to decimal view is worth trying. It doesn’t change the underlying value—6.00 and 5/1 are mathematically identical—but it does simplify the mental arithmetic when you’re scanning multiple markets quickly.
The common decimal prices you’ll encounter map directly onto familiar fractional equivalents. Evens (1/1) becomes 2.00. A 2/1 shot is 3.00. A 10/1 outsider is 11.00. Odds-on prices sit between 1.00 and 2.00: a 1/2 favourite is 1.50, a 4/6 shot is approximately 1.67. Once you’ve memorised a handful of these conversions, the rest become intuitive.
American Odds: Understanding Plus and Minus Lines
American odds—also called moneyline odds—aren’t common in UK horse racing, but you’ll encounter them if you follow US racing coverage, use certain international sportsbooks, or simply stumble onto an American betting platform. The format looks alien at first: +500, -200, +350. The plus and minus signs are doing important work here, and understanding them unlocks a completely different pricing system.
The key principle: American odds are anchored to $100 (or £100, if you prefer). A positive number tells you how much profit you’d make on a $100 stake. A negative number tells you how much you’d need to stake to win $100 profit. That’s the entire system, though it feels backwards if you’ve grown up on fractional pricing.
Take +500. This means a $100 bet returns $500 profit plus your $100 stake—$600 total. That’s equivalent to 5/1 fractional or 6.00 decimal. The higher the positive number, the bigger the outsider. At +1000, you’re looking at a 10/1 shot. At +250, roughly 5/2. Positive American odds always indicate odds-against—horses that pay more in profit than you staked.
Negative numbers represent favourites, and this is where British punters often get confused. At -200, you’d need to stake $200 to win $100 profit. Your total return would be $300. That’s equivalent to 1/2 fractional or 1.50 decimal. The deeper the negative number, the shorter the price. At -500, you’re staking $500 to win $100—equivalent to 1/5 or 1.20 in decimal. These are heavy favourites where risk exceeds potential reward.
Why do Americans use this system? Historically, it relates to how US bookmakers operated and the centrality of the $100 benchmark in their calculations. For UK punters, the main practical application is comparing odds across platforms when one happens to display American formatting, or when betting on US racing—Kentucky Derby or Breeders’ Cup markets, for instance, often appear with moneyline pricing on American-focused sites.
Converting American to decimal requires different formulas depending on whether the number is positive or negative. For positive odds, divide by 100 and add 1. So +500 becomes 5.00 + 1 = 6.00. For negative odds, divide 100 by the absolute value and add 1. So -200 becomes (100 ÷ 200) + 1 = 0.50 + 1 = 1.50. If that sounds complicated in the abstract, it becomes natural with practice.
The mental adjustment isn’t trivial, though. British punters see “5/1” and instinctively know they’re looking at a moderate outsider. Seeing “+500” requires translation before that intuition kicks in. If you’re only occasionally betting on US markets, keeping a conversion table handy (or using your bookmaker’s format toggle) saves time and prevents costly misreads.
Converting Odds: Quick Methods and Formulas
The formulas for converting between odds formats are mechanical, but knowing them matters. When you’re comparing a Betfair exchange price against a bookmaker’s fractional odds and an international site’s American line, you need to translate everything into one system to spot the best value. Here’s how each conversion works, followed by the shortcuts that make it practical.
Fractional to Decimal. Divide the first number by the second, then add 1. At 5/1, that’s (5 ÷ 1) + 1 = 6.00. At 11/4, it’s (11 ÷ 4) + 1 = 2.75 + 1 = 3.75. At 1/3 (odds-on), it’s (1 ÷ 3) + 1 = 0.33 + 1 = 1.33. The “add 1” always accounts for your stake being returned as part of the decimal total.
Decimal to Fractional. Subtract 1, then express the result as a fraction. Decimal 4.00 becomes 4.00 – 1 = 3, which is 3/1. Decimal 2.50 becomes 1.50, which simplifies to 3/2. Decimal 1.80 becomes 0.80, which is 4/5. The tricky part is reducing awkward decimals to clean fractions—2.375 becomes 1.375, or 11/8. This is where mental arithmetic gives way to a calculator for less common prices.
Decimal to American. If the decimal is 2.00 or higher (odds-against), subtract 1 and multiply by 100. Decimal 6.00 becomes (6.00 – 1) × 100 = +500. Decimal 3.50 becomes +250. If the decimal is below 2.00 (odds-on), divide 100 by (decimal – 1) and make it negative. Decimal 1.50 becomes 100 ÷ 0.50 = -200. Decimal 1.25 becomes 100 ÷ 0.25 = -400.
American to Decimal. For positive American odds, divide by 100 and add 1. +400 becomes 4.00 + 1 = 5.00. For negative American odds, divide 100 by the absolute value and add 1. -250 becomes (100 ÷ 250) + 1 = 0.40 + 1 = 1.40.
Now, the practical shortcuts. Most punters don’t convert every price from scratch—they memorise the common equivalents and interpolate from there. Here’s the mental map worth knowing:
Evens = 2.00 decimal = +100 American. 2/1 = 3.00 = +200. 5/1 = 6.00 = +500. 10/1 = 11.00 = +1000. 1/2 = 1.50 = -200. 4/5 = 1.80 = -125 (approximately). 4/9 = 1.44 = -225 (approximately). With these anchors in mind, you can estimate unfamiliar prices without pulling out a calculator.
There’s also the question of implied probability—what any given odds suggest about a horse’s chances. This is the inverse of decimal odds: divide 1 by the decimal price. At 4.00, implied probability is 25 per cent. At 2.00, it’s 50 per cent. At 10.00, it’s 10 per cent. Research published through arXiv analysing over 1 million price change signals across 73 Betfair markets demonstrates that betting exchange markets reflect informed probability assessments remarkably well, with price signals updating as frequently as every 50 milliseconds during active trading. Those decimal prices aren’t arbitrary numbers—they’re a constantly refined collective estimate of how likely each outcome is.
For quick implied probability from fractional odds: divide the denominator by the sum of numerator and denominator. At 3/1, that’s 1 ÷ (3+1) = 25 per cent. At 1/4, it’s 4 ÷ (1+4) = 80 per cent. From American: for positive odds, divide 100 by (odds + 100). At +300, that’s 100 ÷ 400 = 25 per cent. For negative odds, divide the absolute value by (absolute value + 100). At -200, that’s 200 ÷ 300 = 66.7 per cent.
Why does implied probability matter? Because the gap between what odds imply and what you believe the true probability is defines value. If you assess a horse as having a 30 per cent chance but the market offers 5.00 (20 per cent implied), that’s potential value. Conversely, backing a 3/1 shot you think has only a 15 per cent chance is burning money. Understanding odds conversion isn’t just about knowing what you’ll win—it’s about knowing what the market believes.
Putting It Into Practice: Real Race Examples
Theory becomes useful when applied to actual race cards. Let’s walk through a realistic six-runner handicap hurdle—the kind of race you’d encounter on any midweek afternoon at a National Hunt fixture. Each runner’s odds tell a story about how the market sees the contest.
The market leader is priced at 5/4 fractional, or 2.25 decimal, or -125 American. This horse is a warm favourite without being odds-on—the market sees roughly a 44 per cent chance based on implied probability. At this price, a £20 stake returns £45 total (£25 profit plus stake). When a horse sits at this price point in a competitive handicap, the market believes it holds a clear but not overwhelming advantage.
The second favourite trades at 3/1 (4.00 decimal, +300 American)—implied probability around 25 per cent. There’s meaningful separation from the favourite here. Someone backing this horse believes either that the market has underestimated its chance or that the favourite is vulnerable in some way. A £20 stake returns £80.
Third in the betting at 5/1 (6.00, +500) represents a genuine each-way contender. At roughly 17 per cent implied probability, this is a horse expected to hit the frame without necessarily troubling the principals. Many punters view this price point as the sweet spot for each-way betting in fields of this size.
The mid-market runners trade at 8/1 (9.00, +800) and 12/1 (13.00, +1200). These are the outsiders with a perceived chance—horses you wouldn’t be shocked to see run into a place, though outright victory would constitute a minor upset. At 8/1, implied probability sits around 11 per cent; at 12/1, roughly 8 per cent.
Finally, the rank outsider at 25/1 (26.00, +2500). The market gives this horse under 4 per cent implied probability. This doesn’t mean it can’t win—upsets happen—but it does mean that based on form, connections, and market wisdom, victory would represent a significant shock. Backing outsiders at these prices only makes sense if you have specific information or analysis suggesting the market has dramatically underestimated the horse.
Now consider what happens when you compare the same race across different platforms. Bookmaker A shows the favourite at 5/4, but Bookmaker B offers 6/4. That’s 2.25 versus 2.50 decimal—an 11 per cent difference in potential return on the same horse. If you were staking £100, the difference is £25 in profit (£125 vs £150 total return). Multiply that across hundreds of bets and you see why serious punters maintain multiple accounts and always shop for the best price.
The odds also tell you about market structure. When all six runners’ implied probabilities sum to exactly 100 per cent, the market is perfectly priced with no margin. In practice, the total always exceeds 100 per cent—typically 105 to 115 per cent for UK racing, depending on the race type. That excess is the overround, the bookmaker’s built-in edge. Learning to calculate overround from a glance at the odds helps you identify which markets offer tighter pricing and better value.
“Betting exchanges show remarkably high level of informational efficiency in returns,” notes research published through arXiv, “in contrast to financial assets characterized by heavy tails and volatility clustering.” This efficiency means that by the time a race goes off, exchange odds typically reflect a sophisticated collective assessment of each horse’s chances. Reading those odds isn’t just about calculating payouts—it’s about understanding what thousands of informed bettors believe.
You now have the tools to read any odds format confidently. Fractional for the traditional UK market, decimal for exchanges and online betting, American for the occasional international venture. More importantly, you understand that these aren’t three different systems—they’re three different ways of expressing the same underlying relationship between stake, return, and implied probability.
The next step is learning to use that knowledge strategically. Understanding how to convert odds matters less than understanding when odds represent genuine value—when the price on offer exceeds what you believe a horse’s true chances warrant. That’s where profitable betting begins, and it builds directly on the foundation covered here.